
Infographics
While infographics are not that new they have grown quickly and are now pretty standard in posters and while you may not be aware of the term you have certainly seen them (Fantastic Example at the bottom of the post)
I think they offer a great way into subjects and are a good Literacy and Numeracy task rolled into one. I am using them as starter activities for subjects. "Make an infographic on iOS v Android" or "I bet my Twitter account is better than yours..." leave the research to the students and see what happens. You will get great diversity and some great posters for your wall at the beginning of term.

There is a wide range of free online tools, many of them try to get you to pay for extras but you can get away with the free versions. The main contenders are:
 Infogr.am - iPad compatible
Offers great custom charts with a spreadsheet built in
Interactive online versions as well as 2D
6 free templates

 Piktochart.com - iPad incompatible
5 free templates
Easy to use layout

 Visual.ly - iPad compatible
Social networking integration for auto info graphics
Repository of other fantastic infographics to save you time


 Gliffy.com (HTML5) - iPad compatible
Again not directly for infographics but great for flow diagrams
With a bit of creativity you can make complex diagrams

Again thanks for the time to read this post and hope you found it useful
Why not follow me
Thanks
@JerseyITguy
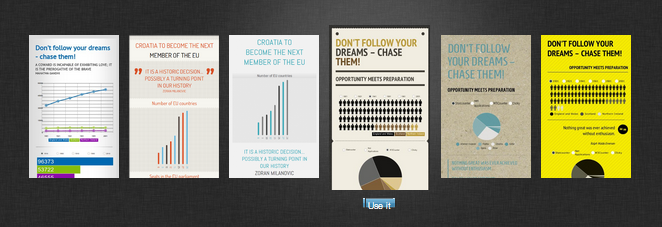
Great example of an infographic for Geography

Not sure what an infographic is - watch this
I think they offer a great way into subjects and are a good Literacy and Numeracy task rolled into one. I am using them as starter activities for subjects. "Make an infographic on iOS v Android" or "I bet my Twitter account is better than yours..." leave the research to the students and see what happens. You will get great diversity and some great posters for your wall at the beginning of term.

There is a wide range of free online tools, many of them try to get you to pay for extras but you can get away with the free versions. The main contenders are:
 Infogr.am - iPad compatible
 Offers great custom charts with a spreadsheet built in
Interactive online versions as well as 2D
6 free templates
 Piktochart.com - iPad incompatible
 5 free templates
Easy to use layout

 Visual.ly - iPad compatible
 Social networking integration for auto info graphics
Repository of other fantastic infographics to save you time


Wordle.net - iPad incompatible
Not for making infographics on its own but great for the images
Take a while to play with the settings for better outcomes

 Gliffy.com (HTML5) - iPad compatible
 Again not directly for infographics but great for flow diagrams
With a bit of creativity you can make complex diagrams

Again thanks for the time to read this post and hope you found it useful
Why not follow me
Thanks
@JerseyITguy
Great example of an infographic for Geography
Infographics
 Reviewed by Rory Steel
on
10:53 AM
Rating:
Reviewed by Rory Steel
on
10:53 AM
Rating:
Reviewed by Rory Steel
on
10:53 AM
Rating:


No comments